 by
by Table of Contents
Last Updated on: July 30, 2021
Most of the discussion on this site will cover chart and candle stick readings as you notice on the trending stock page/section of our website. If you have a hard time understanding the explanation here don’t worry we have a local dialect video (Tagalog) to cover that part. You can just visit my channel Palaboy Trader. And if you think you can learn more from me, just connect to my Patreon Channel.
To be able to read and interpret properly how the share price of a stock moves, we need to understand first how each of the candles are read and interpreted.
Candle stick reading is a must for aspiring traders of the market as this gives us the view of why a particular stock is moving in that direction. Without the basic knowledge, its difficult to tell where the price action is going. And trading blindly is very dangerous as you know well that there is a risk in trading or investing in the market.
A candle stick can represent a summary of price action in different time frames, that is its possible to have 1 candle stick for 1 min, 5 mins, 1 day, 1 weak or 1 month. For all of our studies here we will be referring to 1 day price action movement for 1 candle stick
Let’s have a discussion on what are the parts of a candle.
Candle Stick- a bit of a History
Most popular interpretations of the price action movement in a day have 2 origins or sources, one from the Asia and another from the Western part of the world. Western people are commonly using bar and line graphs while the Japanese candle stick originated in Asia.
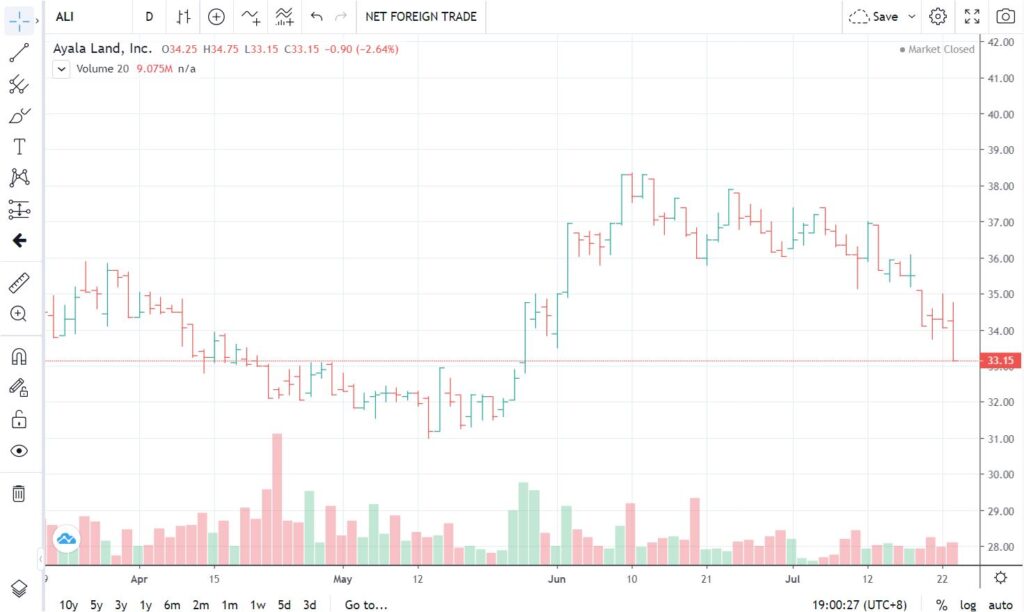
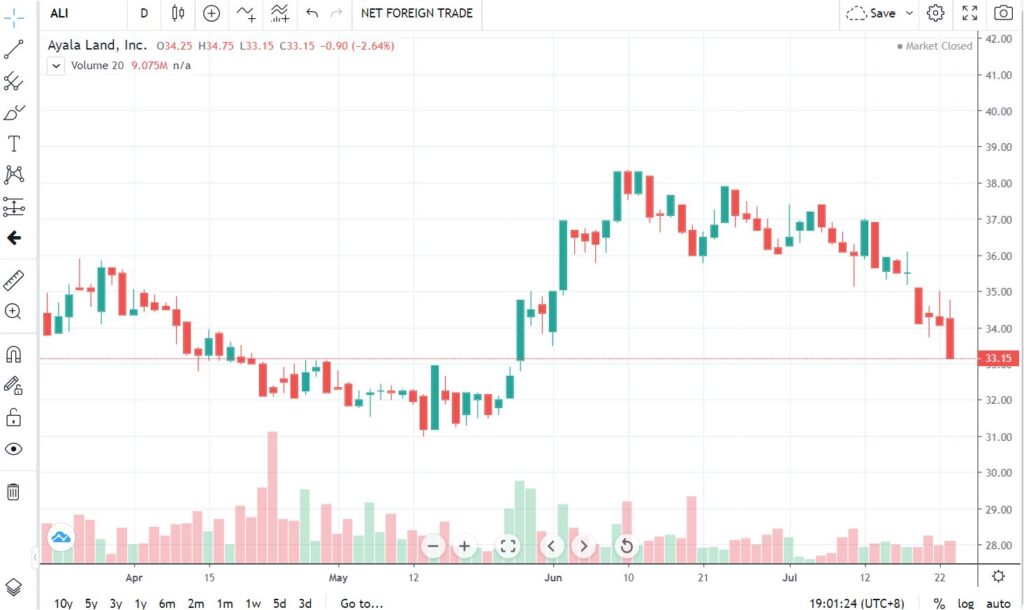
This is how a bar chart looks like, and below is how a candle stick chart looks like. Looks very different.
I’m more inclined to use the candle stick pattern as this is what is commonly use in the Philippines.
Japanese candle stick was invented by Munehisa Homma
Candle Stick Parts/ anatomy
Here is a sample photo of a candle stick. There are only 2 parts we need to remember, the wick and the body.
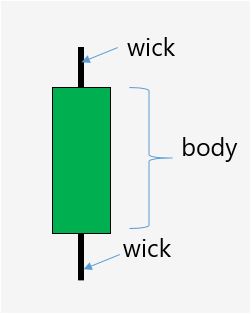
The wick can extend below and above the body of the candle. The body is the solid part of the candle while wick are extended lines of the candle.
But this is not always the case. Through different movements of price action on the day, there will be different combinations of charts you can see as with the sample chart posted with Japanese candlesticks above.
Candle Interpretation
Now we would like to interpret the candle with the positions and its color.
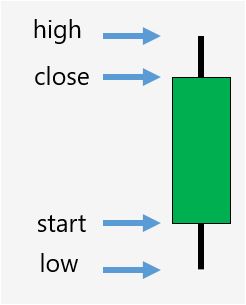
High is the upper most part of the wick, and low is the lowest part of the wick. Now depending on the opening (start) and closing of the body (close) will determine the color of candle. Good to know there are only two colors, one is red and another is just like the above which is green. It will be green when the candle closes higher than the opening price.
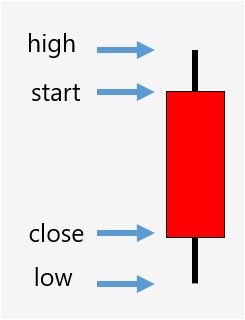
It will be red if it closes below the opening or start position just like the one below.
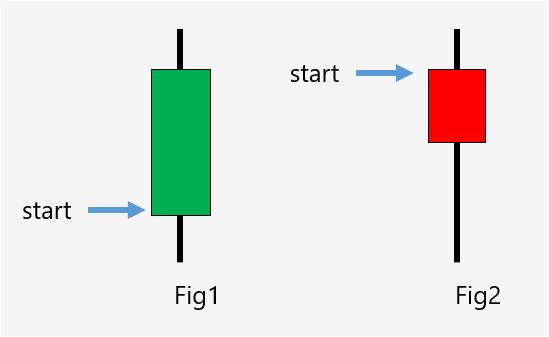
See the samples below, notice how the candle closes and the final color of the candle changes base on where the start of the opening occurred. Figure 1(fig1) shows strong closing or green candle because the body ended green in color and the final price (at the close of the market for the day) ended higher. Figure2 (fig2) shows a weaker candle as the closing of the body is below the start price of the day
Still can keep up? You can always come back and study again the candle formation. It will take some time to remember how to interpret but this is the most basic part of interpreting how it works.
Determining how strong is the candle on the day
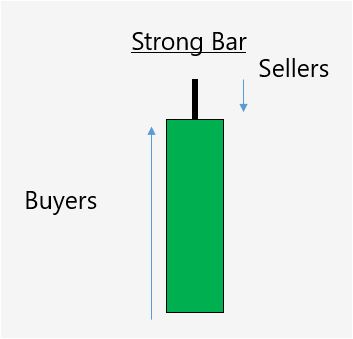
There are only to interpretations of a candle either its weak or a strong bar candle. For the example below, the candle ended in green with a big width for the body. This means the buyers push up the price while sellers managed to push it down a bit, so this is a Strong Bar and a good candle. In Philippine context we are happy to see a long green candle at the end of the day as we can only have a gain for our trade if we ended higher, remember the Price appreciation topic we have? (link)
By the way, there are 2 types of person trading or investing in the market, one is a buyer and another is a seller, it can go in both ways as buyers can later sell there shares also depending on their sentiment
So a weak bar or candle sample is as below, the buyers did not managed to push up the price at the end of the day and sellers prevail. The candle is still green because the start is at the bottom of the candle. For normal trading cases we don’t want to see weak bars at the end of the day.
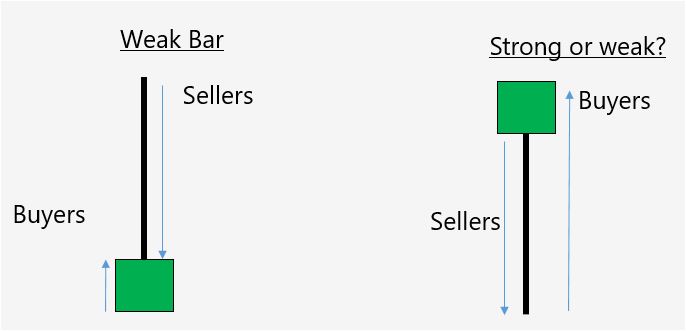
Now with all combinations of candle formation how will you interpret this? This candle is strong as the buyers managed to push up the price at the close. Interpretation that this is strong is on the basis of a single candle formation. Later on if this is combine with other candles and depending on its position it could be a weak candle.
In real time, interpreting the chart whether strong or not cannot be done by single candle alone. As you know the chart is a combination of candles that varies every day base on the economic conditions and underlying fundamental of a stock.
2 Candle stick patterns
So now you can see different combinations of 2 candles at a time. For traders to easily understand how the stock price is behaving, combining 2 or more candles and giving them a name is easier.
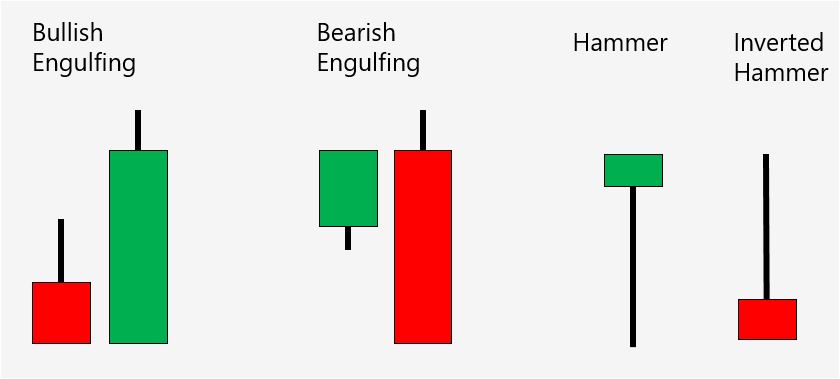
Bullish Engulfing candle
The first day of the candle is in red while 2nd day is a big green candle. We say that this is a bullish engulfing candle as the big green candle is “engulfing” or much higher than the red candle. We say a candle is bullish if the current candle is higher and green in color than the previous candle. For this combination of 2 candles more buyers are in the stock
Bearish Engulfing candle
This is the opposite of the first combination, the previous candle is green or bullish but the next day candle is a big red as the price close much lower and is “engulfing” the green candle. We say it is bearish and this is a negative sentiment on that particular stock
Hammer/ Inverted Hammer
We call this candles as hammer or doji. Well the hammer is more obvious interpretation as it looks like Thor’s hammer (laughing). Japanese interpreters calls this as a dragonfly doji or “doji” as it has similar look as a dragonfly. The interpretation whether bullish(strong) or bearish (weak) depends on its location
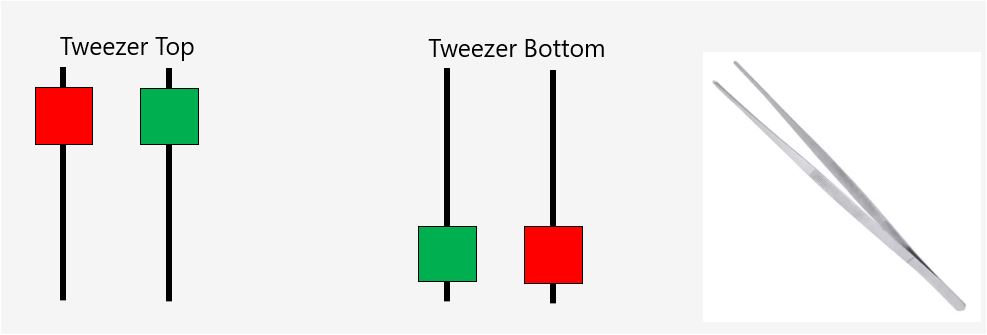
Tweezer top/Bottom
Tweezer top if found at the top of the chart trend its considered bearish but if at the bottom of the trend it is bullish 2 candlestick patter. The same can be said on tweezers bottom.
Other Relevant Candle Formations
Below photo is what we call an undecided candle or also a variation of a Doji. It does look like a gravestone in Japanese cemetery.
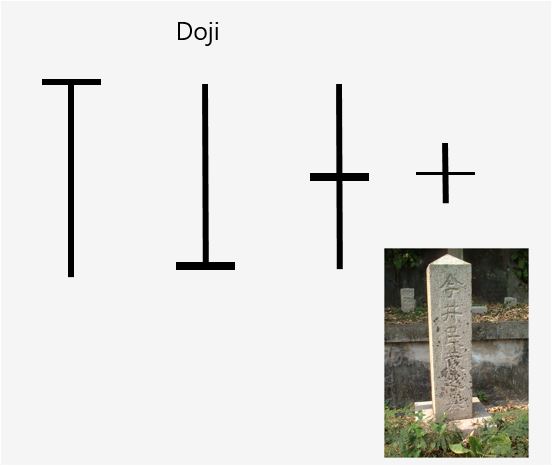
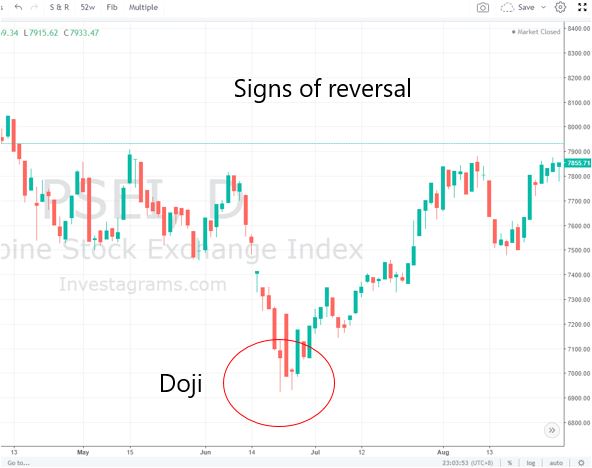
Doji’s or undecided candles interpretation as I mentioned is dependent on its location on the chart. If its on the high of the chart Trend, it is a weak candle but if at the bottom of the trend these are strong candles.
3 Candle stick Patterns
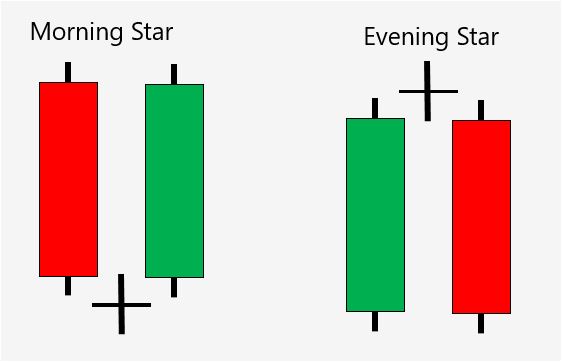
The three candle stick pattern is also very common pattern we see, morning star is bullish combination of a red body candle, doji or undecided candle and big green candle, while the opposite with bearish interpretation is and evening star.
Significance of the patterns
By the time you are used to seeing these patterns you can use them as guide to know whether we are changing in the trend direction of the chart.
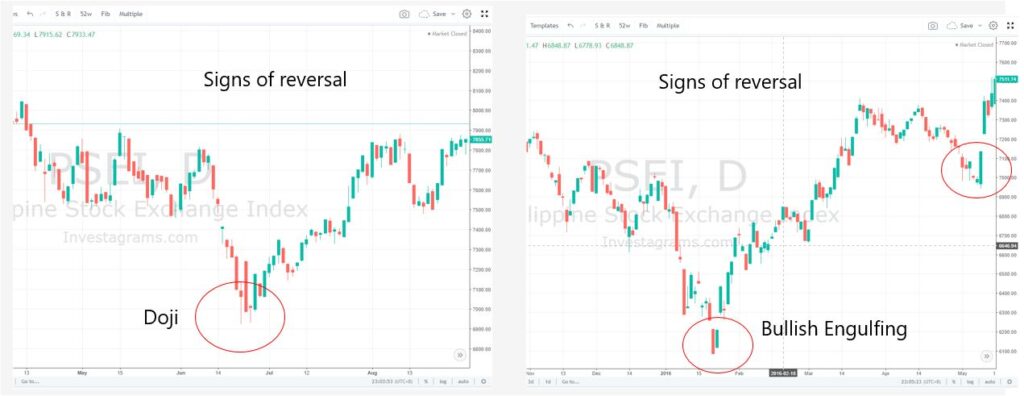
These combinations of the candles below shows a reversal in trend direction from a going down stock price into an upward moving chart. We can see here a Doji and Bullish engulfing candle at the bottom
These combinations shows a bullish to bearish reversal, we see bearish engulfing and Doji’s at the top of the chart price trend.
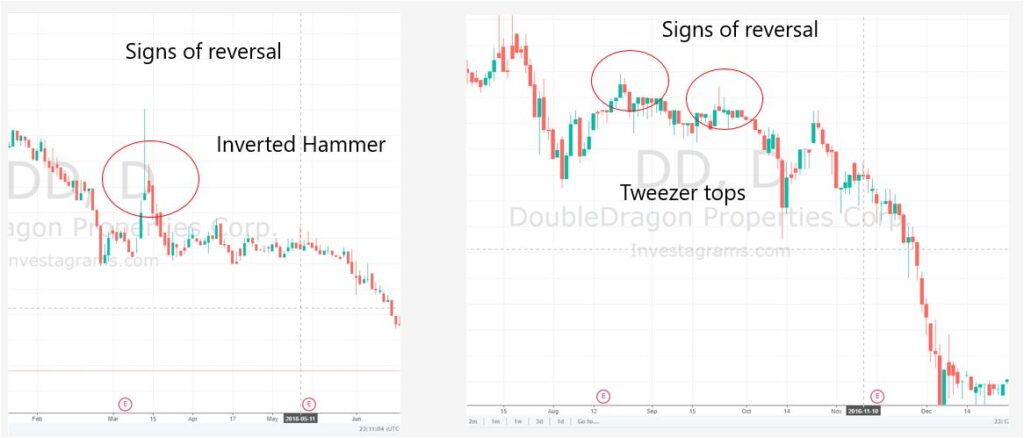
Another example of inverted hammer and Tweezer tops at the top of the chart signaling a weak chart formation
Candle Stick Chart Patterns
Most of the discussion on this site will cover chart and candle stick readings as you notice on the trending stock page/section of our website. If you have a hard time understanding the explanation here don’t worry we have a local dialect video (Tagalog) to cover that part. You can just visit my channel Palaboy Trader. And if you think you can learn more from me, just connect to my Patreon Channel.
To be able to read and interpret properly how the share price of a stock moves, we need to understand first how each of the candles are read and interpreted.
Candle stick reading is a must for aspiring traders of the market as this gives us the view of why a particular stock is moving in that direction. Without the basic knowledge, its difficult to tell where the price action is going. And trading blindly is very dangerous as you know well that there is a risk in trading or investing in the market.