Table of Contents
Last Updated on: July 30, 2021
There are 3 different trend directions that we can see in the market, Uptrend, downtrend or sideways direction. This is very important basic requirement to understand as it will give us a sense of direction where the overall price action is moving.
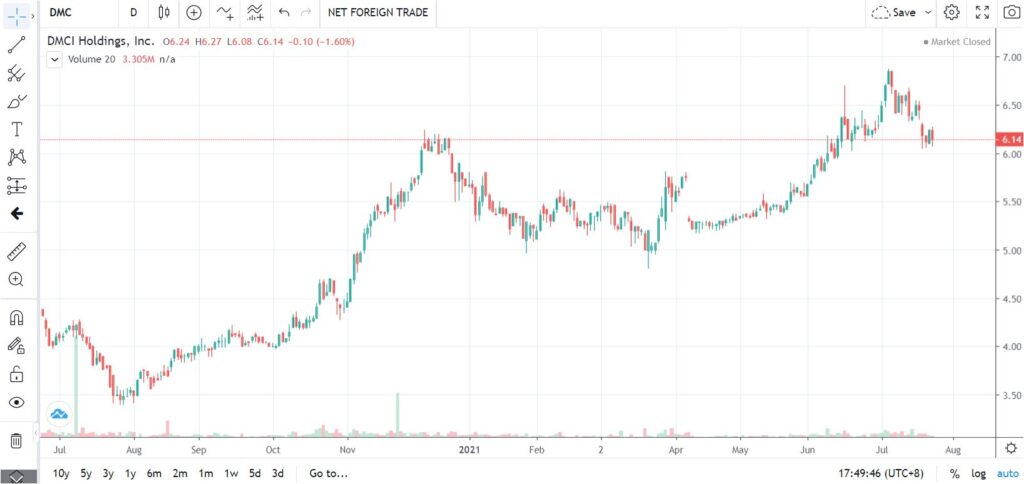
To the untrained eyes the stocks share price seems to move in random direction as it is consist of series of candles for each day of trading. See sample below for a price action of a stock called DMC.
Uptrend
The market for a certain stock or share prices is moving upward in this direction. It is characterized by a series of higher highs and higher lows formation. Let me illustrate this so we can understand the terminologies that we are using.
This picture of the Philippine stock exchange index (PSEI) is consist of candle sticks from day to day trading. One candle is added to the charts each day that we have activity in the market.
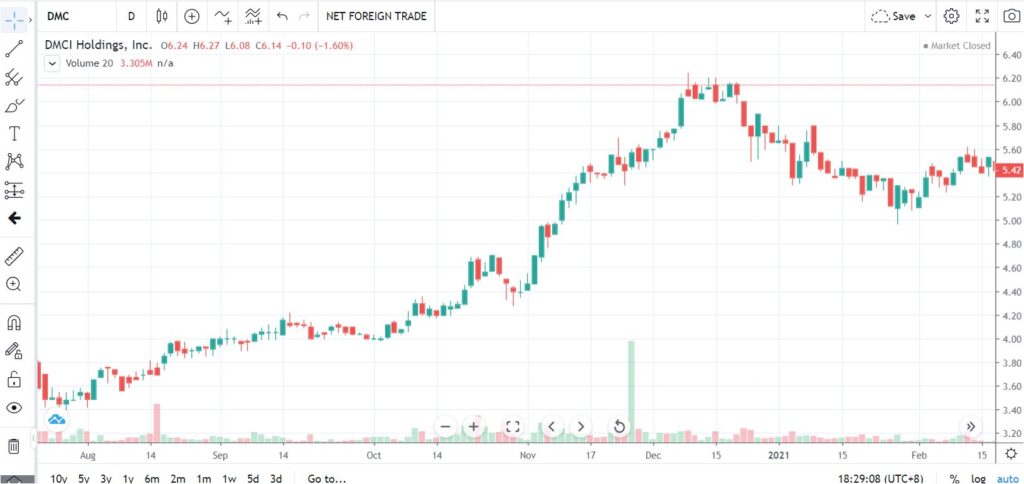
When I draw a straight line to show the overall candle movement we can see that its direction we can easily view that the trend of the candles is moving upward. So this is an example of an uptrend stock. For trading and investing in the market this is what we normally want to see so that when we buy we could expect a price appreciation which in turn would give as gains or profits on the market.
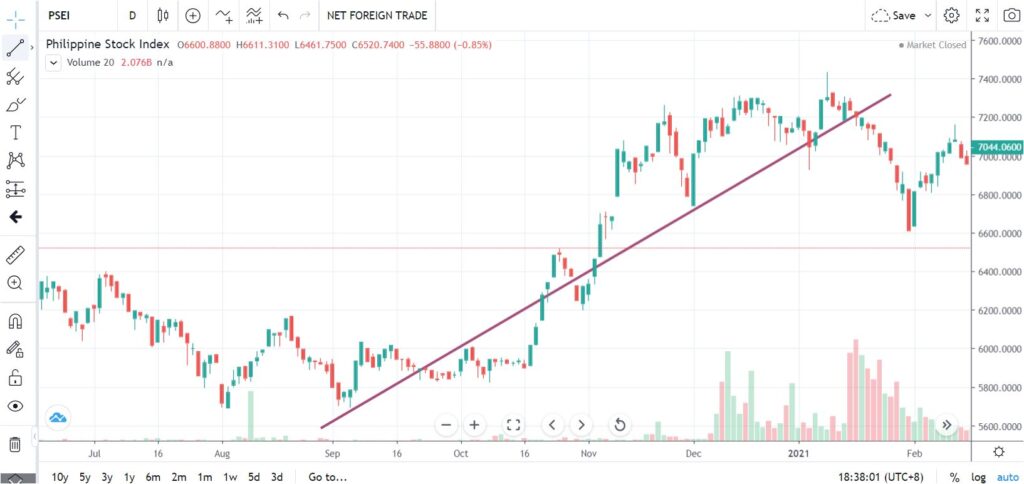
However, if you try to inspect carefully the candles are not moving in a straight line but rather we can see a series of zigzag lines going up and down, once I draw a line just following how the candles move we can see the zigzag movement

Now from the above picture I have mark the peaks of each cycle a candle is having. A letter “H” is indicated when it’s in peak position and “L” if it goes down and later rebounded back. This is what I meant when I said the uptrend cycle is consist of Highs (H) going higher in position and its lows (L) having a higher position. An uptrend stocks is also called a bullish stock.
Downtrend
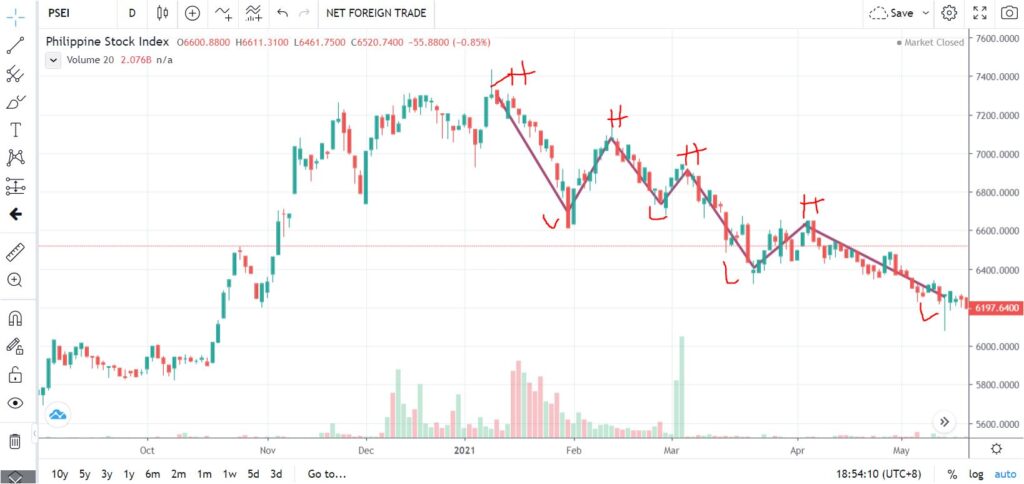
On the opposite side if the trend direction of the chart is going down and it has a series of lower highs (H) and lower lows (L) this is a downtrend direction. You can draw a straight line first following overall candle movement and then later trace the candle movement just like what we did above
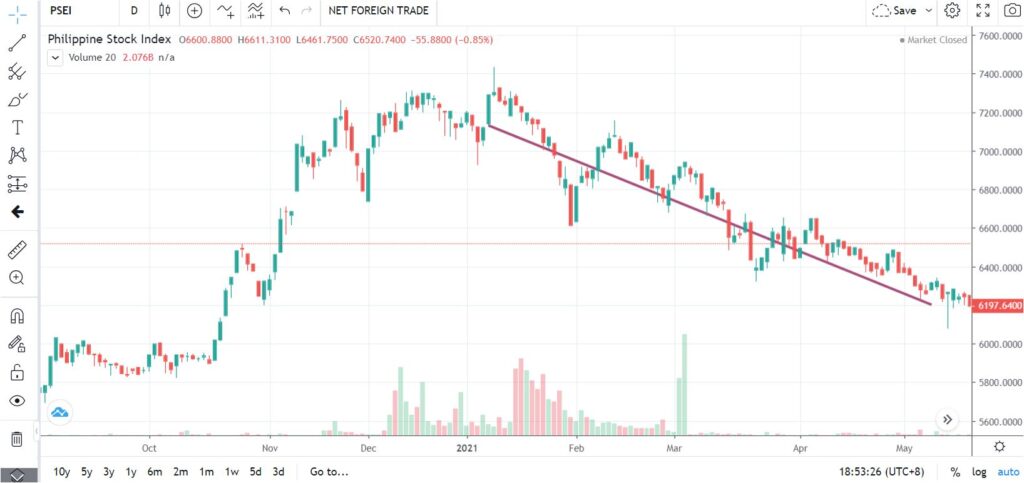
Downtrend Series of lower highs and lower lows. The set of highs and lows can be seen cascading in downward direction
Sideways
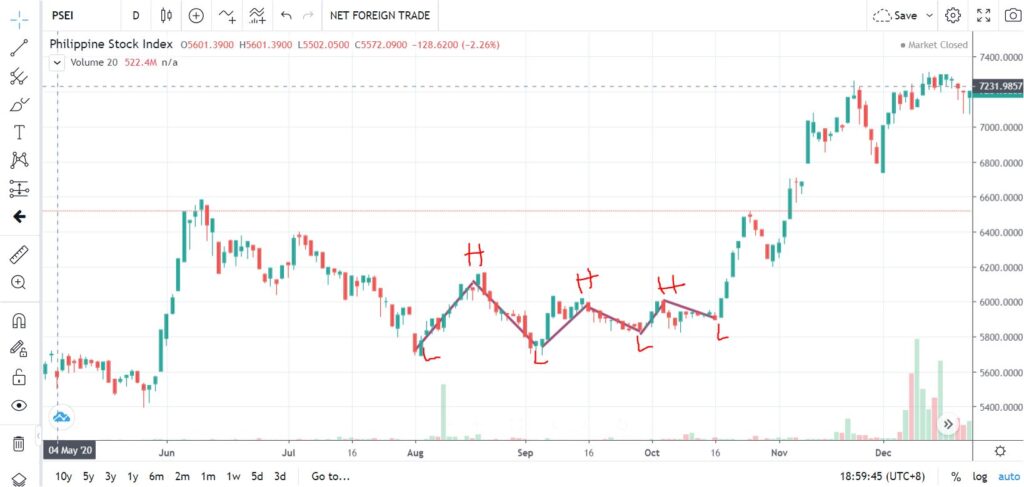
We can see this pattern when the definition of series of highs and lows could not be seen properly and overall picture the chart candles are showing are moving neither up nor down
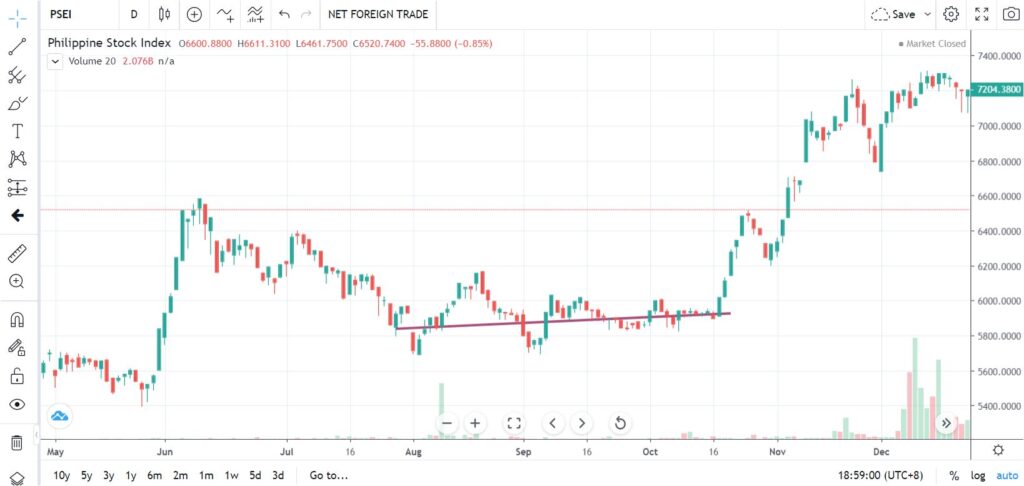
Here you can see the highs are going down but the lows side are not going up or down.
Traders rely on the graphical interpretation of how the chart is moving so we know that we have a high chance of winning the trade if it moves in our direction. As I have mentioned in Philippine trading, you can only have price appreciation or gains in the market if you are in uptrend direction. So for most cases to maximize profit we need to stay only when we have uptrend direction. The plotting done showing zigzag patterns will easily tell us when the market trend is shifting so we can react accordingly.
In some cases the market trend does not follow the 3 different directions that we have classified. In the classification of stocks known as “penny” category as the prices are on the low range of prices (below 1 peso) with low market capitalizations you can expect to see sudden up move or down move only. These stocks are difficult to trade because the prices action is controlled by emotions and not by normal trend directions.
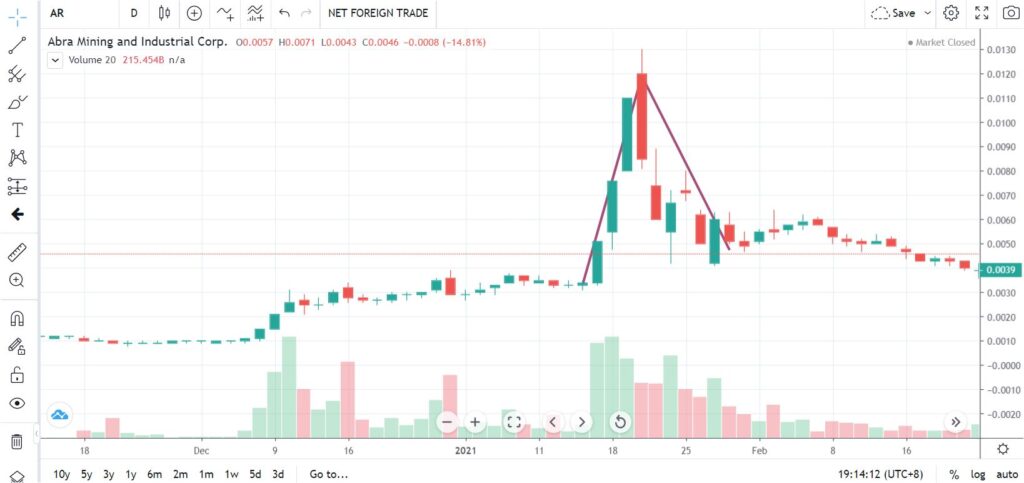
We will later have discussions for this type of stocks.
Here is the video explaining the trend directions


